
Chapter 3 Survey data documentation
3.1 Introduction
Survey documentation helps us prepare before we look at the actual survey data. The documentation includes technical guides, questionnaires, codebooks, errata, and other useful resources. By taking the time to review these materials, we can gain a comprehensive understanding of the survey data (including research and design decisions discussed in Chapters 2 and 10) and conduct our analysis more effectively.
Survey documentation can vary in organization, type, and ease of use. The information may be stored in any format—PDFs, Excel spreadsheets, Word documents, and so on. Some surveys bundle documentation together, such as providing the codebook and questionnaire in a single document. Others keep them in separate files. Despite these variations, we can gain a general understanding of the documentation types and what aspects to focus on in each.
3.2 Types of survey documentation
3.2.1 Technical documentation
The technical documentation, also known as user guides or methodology/analysis guides, highlights the variables necessary to specify the survey design. We recommend concentrating on these key sections:
- Introduction: The introduction orients us to the survey. This section provides the project’s background, the study’s purpose, and the main research questions.
- Study design: The study design section describes how researchers prepared and administered the survey.
- Sample: The sample section describes the sample frame, any known sampling errors, and limitations of the sample. This section can contain recommendations on how to use sampling weights. Look for weight information, whether the survey design contains strata, clusters/PSUs, or replicate weights. Also, look for population sizes, finite population correction, or replicate weight scaling information. Additional detail on sample designs is available in Chapter 10.
- Notes on fielding: Any additional notes on fielding, such as response rates, may be found in the technical documentation.
The technical documentation may include other helpful resources. For example, some technical documentation includes syntax for SAS, SUDAAN, Stata, and/or R, so we do not have to create this code from scratch.
3.2.2 Questionnaires
A questionnaire is a series of questions used to collect information from people in a survey. It can ask about opinions, behaviors, demographics, or even just numbers like the count of lightbulbs, square footage, or farm size. Questionnaires can employ different types of questions, such as closed-ended (e.g., select one or check all that apply), open-ended (e.g., numeric or text), Likert scales (e.g., a 5- or 7-point scale specifying a respondent’s level of agreement to a statement), or ranking questions (e.g., a list of options that a respondent ranks by preference). It may randomize the display order of responses or include instructions that help respondents understand the questions. A survey may have one questionnaire or multiple, depending on its scale and scope.
The questionnaire is another important resource for understanding and interpreting the survey data (see Section 2.4.3), and we should use it alongside any analysis. It provides details about each of the questions asked in the survey, such as question name, question wording, response options, skip logic, randomizations, display specifications, mode differences, and the universe (the subset of respondents who were asked a question).
In Figure 3.1, we show an example from the American National Election Studies (ANES) 2020 questionnaire (American National Election Studies 2021). The figure shows the question name (POSTVOTE_RVOTE), description (Did R Vote?), full wording of the question and responses, response order, universe, question logic (this question was only asked if vote_pre = 0), and other specifications. The section also includes the variable name, which we can link to the codebook.
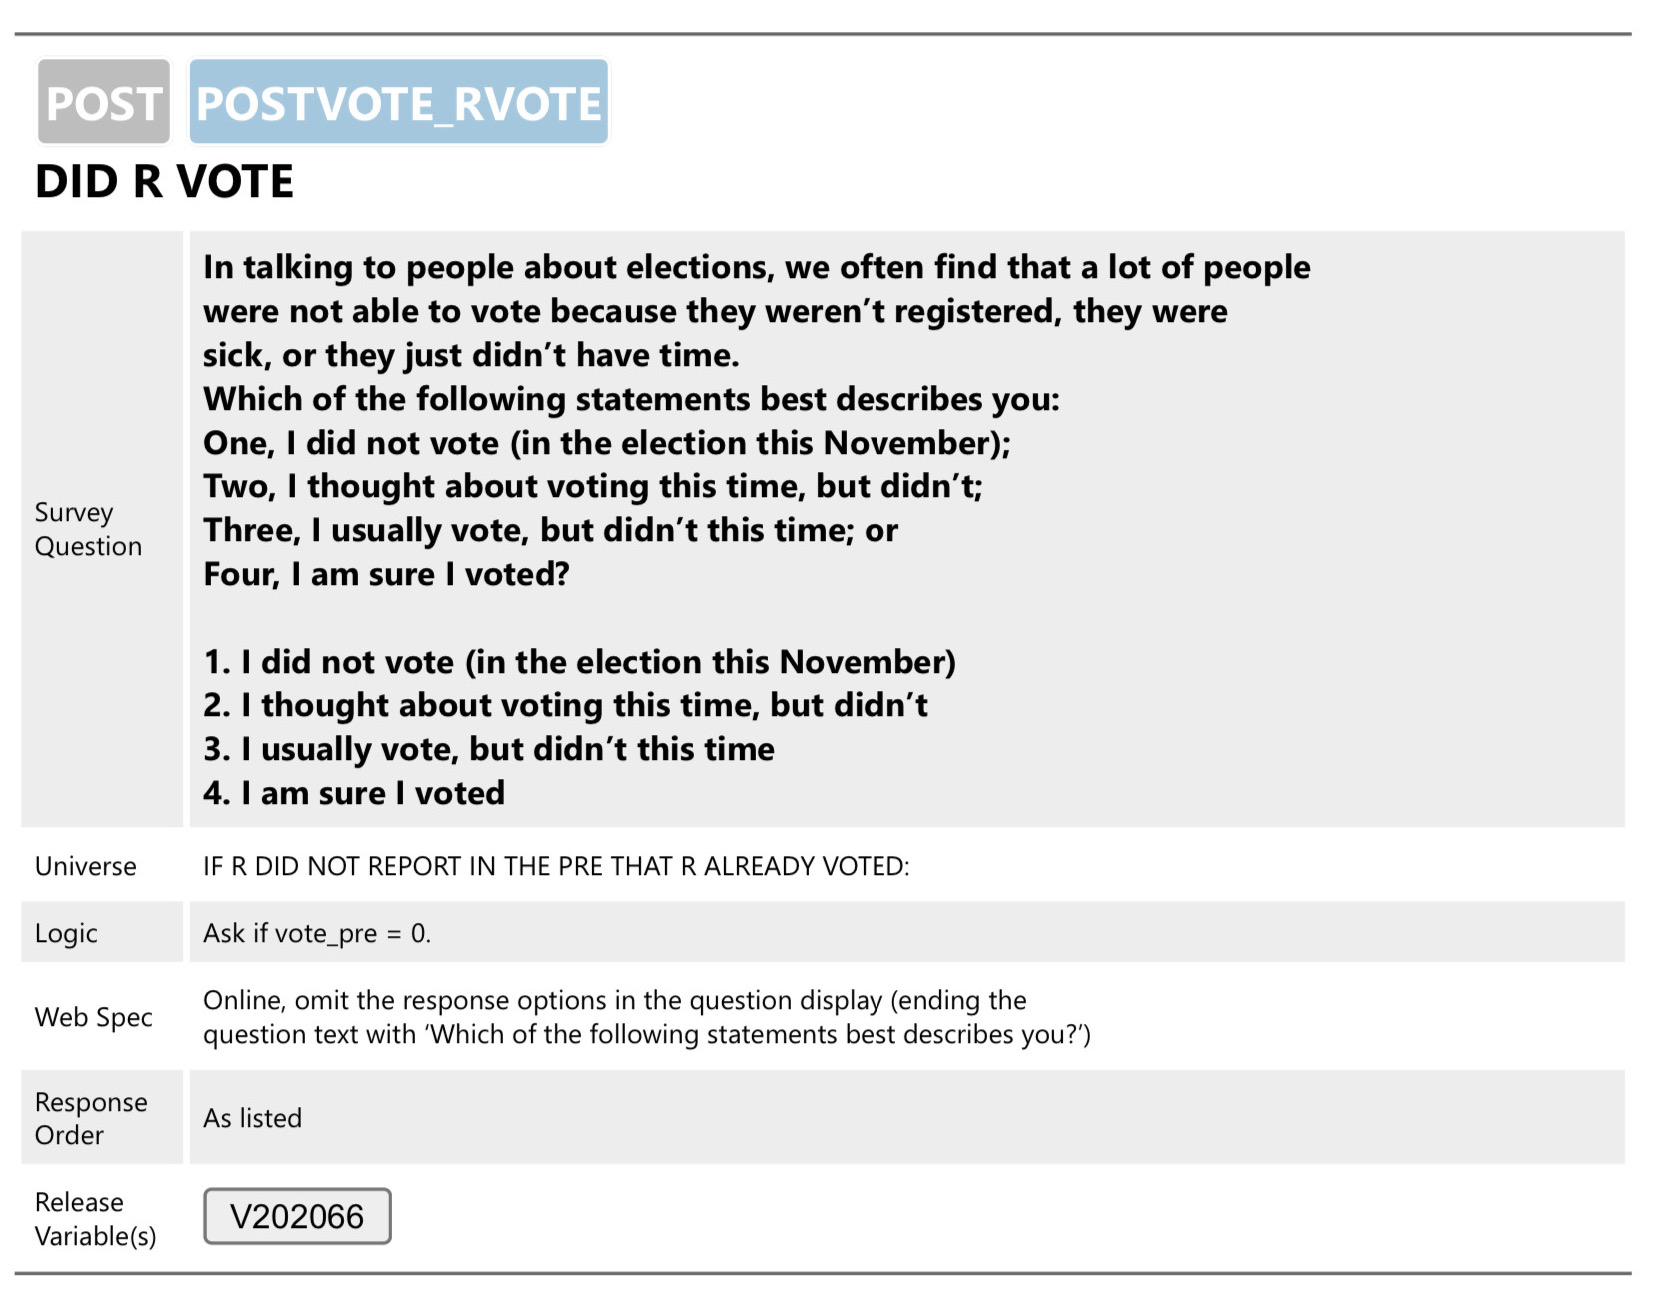
FIGURE 3.1: ANES 2020 questionnaire example
The content and structure of questionnaires vary depending on the specific survey. For instance, question names may be informative (like the ANES example above), sequential, or denoted by a code. In some cases, surveys may not use separate names for questions and variables. Figure 3.2 shows an example from the Behavioral Risk Factor Surveillance System (BRFSS) questionnaire that shows a sequential question number and a coded variable name (as opposed to a question name) (Centers for Disease Control and Prevention (CDC) 2021).
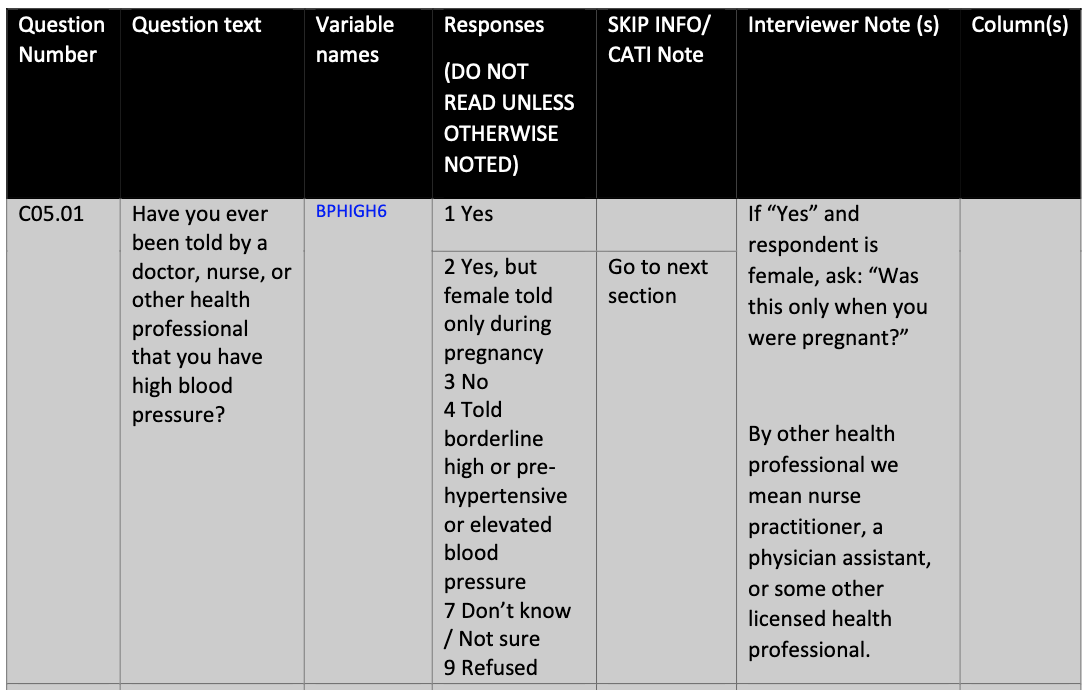
FIGURE 3.2: BRFSS 2021 questionnaire example
We should factor in the details of a survey when conducting our analyses. For example, surveys that use various modes (e.g., web and mail) may have differences in question wording or skip logic, as web surveys can include fills or automate skip logic. If large enough, these variations could warrant separate analyses for each mode.
3.2.3 Codebooks
While a questionnaire provides information about the questions posed to respondents, the codebook explains how the survey data were coded and recorded. It lists details such as variable names, variable labels, variable meanings, codes for missing data, value labels, and value types (whether categorical, continuous, etc.). The codebook helps us understand and use the variables appropriately in our analysis. In particular, the codebook (as opposed to the questionnaire) often includes information on missing data. Note that the term data dictionary is sometimes used interchangeably with codebook, but a data dictionary may include more details on the structure and elements of the data.
Figure 3.3 is a question from the ANES 2020 codebook (American National Election Studies 2022). This section indicates a variable’s name (V202066), question wording, value labels, universe, and associated survey question (POSTVOTE_RVOTE).
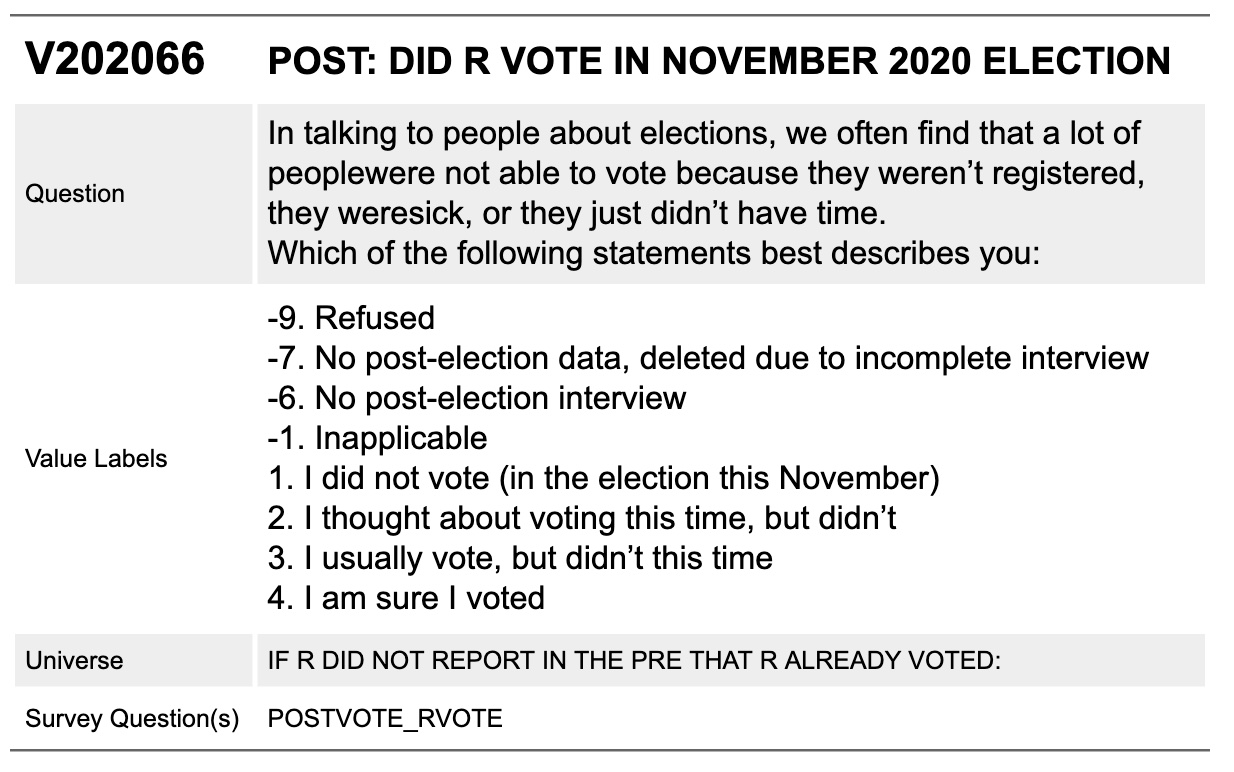
FIGURE 3.3: ANES 2020 codebook example
Reviewing the questionnaires and codebooks in parallel can clarify how to interpret the variables (Figures 3.1 and 3.3), as questions and variables do not always correspond directly to each other in a one-to-one mapping. A single question may have multiple associated variables, or a single variable may summarize multiple questions.
3.2.4 Errata
An erratum (singular) or errata (plural) is a document that lists errors found in a publication or dataset. The purpose of an erratum is to correct or update inaccuracies in the original document. Examples of errata include:
- Issuing a corrected data table after realizing a typo or mistake in a table cell
- Reporting incorrectly programmed skips in an electronic survey where questions are skipped by the respondent when they should not have been
For example, the 2004 ANES dataset released an erratum, notifying analysts to remove a specific row from the data file due to the inclusion of a respondent who should not have been part of the sample. Adhering to an issued erratum helps us increase the accuracy and reliability of analysis.
3.2.5 Additional resources
Survey documentation may include additional material, such as interviewer instructions or “show cards” provided to respondents during interviewer-administered surveys to help respondents answer questions. Explore the survey website to find out what resources were used and in what contexts.
3.3 Missing data coding
Some observations in a dataset may have missing data. This can be due to design or nonresponse, and these concepts are detailed in Chapter 11. In that chapter, we also discuss how to analyze data with missing values. This chapter walks through how to understand documentation related to missing data.
The survey documentation, often the codebook, represents the missing data with a code. The codebook may list different codes depending on why certain data points are missing. In the example of variable V202066 from the ANES (Figure 3.3), -9 represents “Refused,” -7 means that the response was deleted due to an incomplete interview, -6 means that there is no response because there was no follow-up interview, and -1 means “Inapplicable” (due to a designed skip pattern).
As another example, there may be a summary variable that describes the missingness of a set of variables — particularly with “select all that apply” or “multiple response” questions. In the National Crime Victimization Survey (NCVS), respondents who are victims of a crime and saw the offender are asked if the offender had a weapon and then asked what the type of weapon was. This part of the questionnaire from 2021 is shown in Figure 3.4 (U. S. Bureau of Justice Statistics 2020).

FIGURE 3.4: Excerpt from the NCVS 2020-2021 Crime Incident Report - Weapon Type
For these multiple response variables (select all that apply), the NCVS codebook includes what they call a “lead-in” variable that summarizes the response. This lead-in variable provides metadata information on how a respondent answered the question. For example, question 23a on the weapon type, the lead-in variable is V4050 (shown in Figure 3.5) indicates the quality and type of response (U. S. Bureau of Justice Statistics 2022). In the codebook, this variable is then followed by a set of variables for each weapon type. An example of one of the individual variables from the codebook, the handgun (V4051), is shown in Figure 3.6 (U. S. Bureau of Justice Statistics 2022). We will dive into how to analyze this variable in Chapter 11.
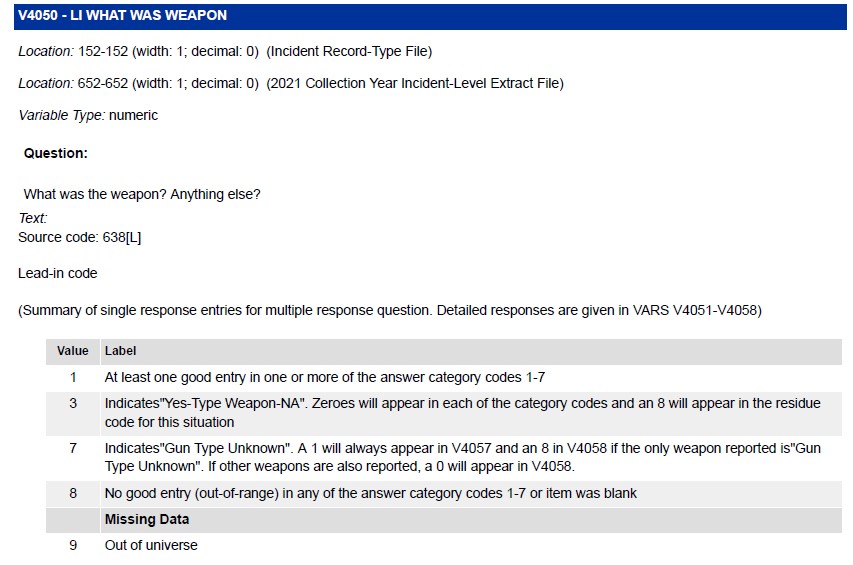
FIGURE 3.5: Excerpt from the NCVS 2021 Codebook for V4050 - LI WHAT WAS WEAPON
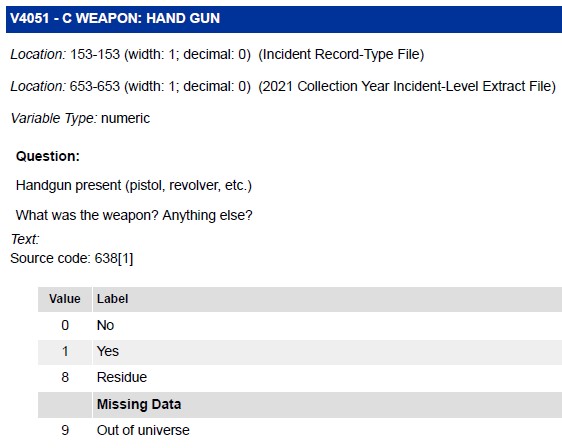
FIGURE 3.6: Excerpt from the NCVS 2021 Codebook for V4051 - C WEAPON: HAND GUN
When data are read into R, some values may be system missing, that is they are coded as NA even if that is not evident in a codebook. We discuss in Chapter 11 how to analyze data with NA values and review how R handles missing data in calculations.
3.4 Example: ANES 2020 survey documentation
Let’s look at the survey documentation for the ANES 2020 and the documentation from their website. Navigating to “User Guide and Codebook” (American National Election Studies 2022), we can download the PDF that contains the survey documentation, titled “ANES 2020 Time Series Study Full Release: User Guide and Codebook.” Do not be daunted by the 796-page PDF. Below, we focus on the most critical information.
Introduction
The first section in the User Guide explains that the ANES 2020 Times Series Study continues a series of election surveys conducted since 1948. These surveys contain data on public opinion and voting behavior in the U.S. presidential elections. The introduction also includes information about the modes used for data collection (web, live video interviewing, or CATI). Additionally, there is a summary of the number of pre-election interviews (8,280) and post-election re-interviews (7,449).
Sample design and respondent recruitment
The section “Sample Design and Respondent Recruitment” provides more detail about the survey’s sequential mixed-mode design. All three modes were conducted one after another and not at the same time. Additionally, it indicates that for the 2020 survey, they resampled all respondents who participated in the 2016 ANES, along with a newly drawn cross-section:
The target population for the fresh cross-section was the 231 million non-institutional U.S. citizens aged 18 or older living in the 50 U.S. states or the District of Columbia.
The document continues with more details on the sample groups.
Data analysis, weights, and variance estimation
The section “Data Analysis, Weights, and Variance Estimation” includes information on weights and strata/cluster variables. Reading through, we can find the full sample weight variables:
For analysis of the complete set of cases using pre-election data only, including all cases and representative of the 2020 electorate, use the full sample pre-election weight, V200010a. For analysis including post-election data for the complete set of participants (i.e., analysis of post-election data only or a combination of pre- and post-election data), use the full sample post-election weight, V200010b. Additional weights are provided for analysis of subsets of the data…
The document provides more information about the design variables, summarized in Table 3.1.
| For weight | Variance unit/cluster | Variance stratum |
|---|---|---|
| V200010a | V200010c | V200010d |
| V200010b | V200010c | V200010d |
Methodology
The user guide mentions a supplemental document called “How to Analyze ANES Survey Data” (DeBell 2010) as a how-to guide for analyzing the data. In this document, we learn more about the weights, and that they sum to the sample size and not the population. If our goal is to calculate estimates for the entire U.S. population instead of just the sample, we must adjust the weights to the U.S. population. To create accurate weights for the population, we need to determine the total population size at the time of the survey. Let’s review the “Sample Design and Respondent Recruitment” section for more details:
The target population for the fresh cross-section was the 231 million non-institutional U.S. citizens aged 18 or older living in the 50 U.S. states or the District of Columbia.
The documentation suggests that the population should equal around 231 million, but this is a very imprecise count. Upon further investigation of the available resources, we can find the methodology file titled “Methodology Report for the ANES 2020 Time Series Study” (DeBell et al. 2022). This file states that we can use the population total from the Current Population Survey (CPS), a monthly survey sponsored by the U.S. Census Bureau and the U.S. Bureau of Labor Statistics. The CPS provides a more accurate population estimate for a specific month. Therefore, we can use the CPS to get the total population number for March 2020, when the ANES was conducted. Chapter 4 goes into detailed instructions on how to calculate and adjust this value in the data.